Page updated:
March 6, 2021
Author: Curtis Mobley
View PDF
A Common Misconception
One sometimes sees statements like “The human eye has evolved to take advantage of the Sun’s maximum output at visible wavelengths,” or “Most plants are green because the Sun’s maximum output is at green wavelengths.” At first glance, this idea seems plausible given the plots of solar irradiance on the solar energy page, which show that the Sun’s spectral irradiance peaks near 500 nm when the irradiance is plotted as a function of wavelength. However, these speculations about the relation between eye or plant evolution and solar output are simply wrong.
Suppose that we have measured the temperature at one-minute intervals over the course of a day. We then have a point function: given a point in time to the nearest minute, the function returns the temperature at that time. If you ask, “When was the hottest part of the day?”, you can answer the question simply by plotting the function and seeing where it is a maximum, say at 3:35 PM. It doesn’t matter if you measured the temperature in Celsius, Fahrenheit, or Kelvin, the time of the temperature maximum will still be 3:35 PM.
Now consider the question, “Where is the Sun’s output a maximum?” The answer is not so simple, because the Sun’s spectral output, or that of a blackbody, is not a point function. Spectra are distributions or density functions. That is, they show the distribution of energy or photon numbers per unit wavelength, frequency, or wavenumber interval. If you change the “per unit” spectral variable, you change the overall shape of the function so that it will have its maximum at a different location.
Figure 1 shows plots of energy irradiance as functions of both wavelength and frequency. The red line is the solar irradiance at the top of the atmosphere. The green curve in the left panel is the corresponding blackbody irradiance for a temperature of 5782 K, reduced by the distance of the Earth from the Sun (this curve is a plot of Eq. (4) on the blackbody radiation page). There is a fairly good overall fit between the Sun’s irradiance and a blackbody spectrum, at least if you ignore the Fraunhofer absorption lines in the solar spectrum. The peak of the blackbody irradiance spectrum is at 501 nm for a temperature of 5782 K. This corresponds to a frequency of . The right panel of the plot shows the same solar data plotted as a function of frequency, along with the corresponding blackbody spectrum (generated from the formula of Table 1 of the blackbody page). Note that when plotted as a function of frequency, the solar and blackbody spectra have their maxima near , which is not the frequency corresponding to the maximum when plotted as a function of wavelength in the left panel. Indeed, corresponds to a wavelength of . In other words, when plotted as a function of wavelength, the solar irradiance is a maximum near 500 nm, in the visible, whereas the maximum is at 880 nm, in the near infrared, when the spectrum is plotted as a function of frequency. This occurs because the relationship between wavelength and frequency is not linear, so that a unit wavelength interval corresponds to a different size of frequency interval for each wavelength: .
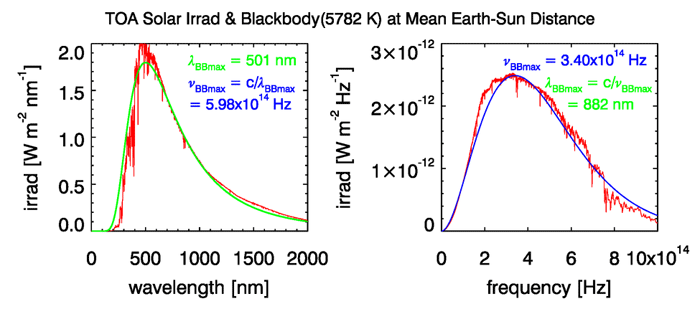
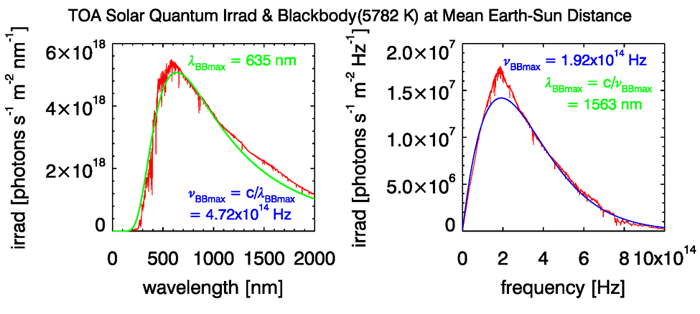
Figure 2 shows the solar photon irradiance and the corresponding blackbody spectra (generated using the and formulas from Table 1 of the blackbody page). Now the maximum is at 635 nm when plotted as a function of wavelength and at 1563 nm, in the short-wave infrared, when plotted as a function of frequency. The maxima are at still different locations if the spectra are plotted as a function of wavenumber.
Thus the answer to the question, “Where is the Sun’s output a maximum?” is, without much exaggeration, “Wherever you would like it to be: just pick whether you want to measure output as energy or numbers of photons and pick an appropriate spectral variable.”
There are indeed good evolutionary reasons why eyes see best at visible wavelengths and why plants are green. However, those reasons are most likely related to wavelengths where water is most transparent (a point function, as is the response function of the human eye), and to the thermodynamic instability of molecules that could be used as receptors for infrared radiation in either eyes or plants. The apparent correlation between the wavelengths where we see best and solar maximum output is a false one resulting simply from a choice of spectral variable for how most people plot solar spectral irradiance. Interestingly, no one seems to argue that eyes should have evolved to take advantage of the maximum of solar photon irradiance in the infrared when plotted as a function of frequency, even though eye pigments absorb individual photons based on the frequencies corresponding to transitions between molecular energy levels.
The delightful paper by Soffer and Lynch (1999) goes into more detail on these matters, and cites various papers that have misunderstood the nature of distribution functions in the context of vision and evolution.
 See comments posted for this page and leave your own.