Page updated:
October 13, 2021
Author: Curtis Mobley
View PDF
The Fournier-Forand Phase Function
Fournier and Forand (1994) derived an approximate analytic form for the phase function of an ensemble of particles that have a hyperbolic (Junge) particle size distribution, with each particle scattering according to the anomalous diffraction approximation to the exact Mie theory . [For a hyperbolic or Junge cumulative size distribution, the number of particles per unit volume with size greater than (volume-equivalent spherical radius) is proportional to , so that is the slope of the size distribution when is plotted vs . Oceanic particle size distributions typically have values between 3 and 5.] In its latest form (Fournier and Jonasz, 1999) this phase function is given by
where
| (2) |
Here is the real index of refraction of the particles, is the slope parameter of the hyperbolic distribution, and is evaluated at . Equation (1) can be integrated to obtain the backscatter fraction,
| (3) |
where is evaluated at . Although Eq. (2) uses only the real part of the index of refraction, the addition of moderate amounts of absorption does not significantly change the shape of the phase functions generated by Eq. (1).
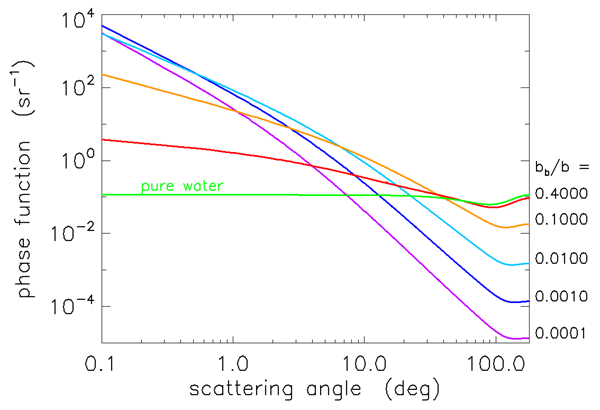
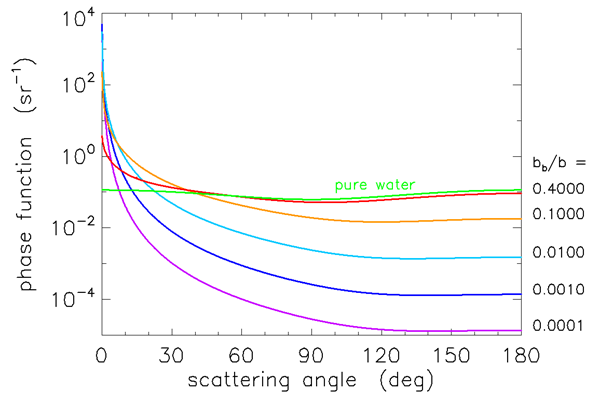
Figures 1 and 2 show Fournier-Forand phase functions for a wide range of values; each curve is labeled by its backscatter fraction. Most oceanic particles have backscatter fractions between (e.g., very large phytoplankton) and 0.1 (e.g., very small mineral particles). Table 1 shows the and values used in Eqs. (1) and (2) to obtain these curves.
Figures 3 and 4 show how well the Fournier-Forand phase function can reproduce the shapes of measured phase functions for the types of particles found in ocean water. In those figures, the blue curves are three phase functions measured by the Volume Scattering Meter (VSM) of Lee and Lewis (2003), and the green curve is the Petzold average-particle phase function. The red curves show the Fournier-Forand phase functions with the same backscatter fractions as the measured phase functions. Each pair of measured and FF phase functions is labeled by the backscatter fraction in Fig. 4.
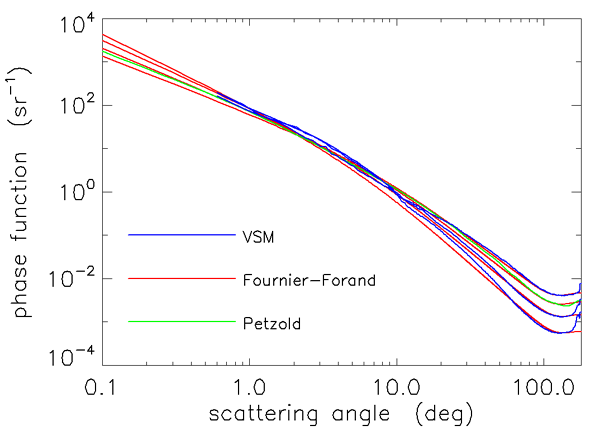
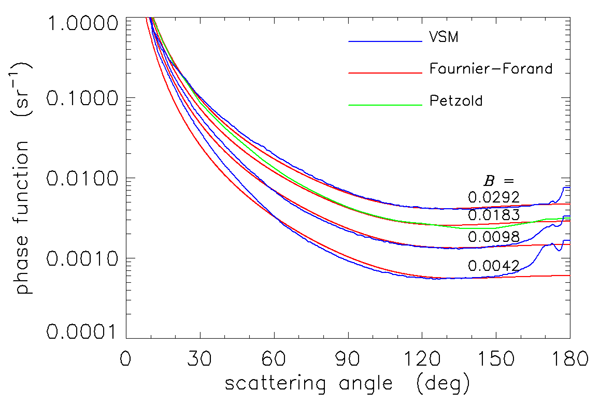
As seen in Figs. 3 and 4, the Fournier-Forand analytical model does a much better job of reproducing the shapes of ocean phase functions than does the Henyey-Greenstein phase function (or any other previously developed analytical model), especially at very small angles. There is considerable discrepancy between the measured and modeled VSM data at wavelengths near 180 deg, but it is not known how much of this may be due to instrumental error. In any case, Fournier-Forand phase functions give the best fits to measurements of any analytical model yet developed. They therefore are now commonly used in numerical simulations (e.g., in HydroLight) and have replaced other analytic models for oceanographic simulations. The light fields resulting from the use of Fournier-Forand and several other measured and modeled phase functions in numerical simulations are compared in Mobley et al. (2002).
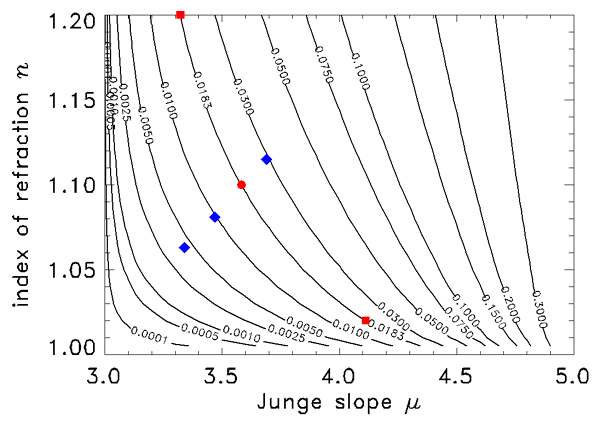
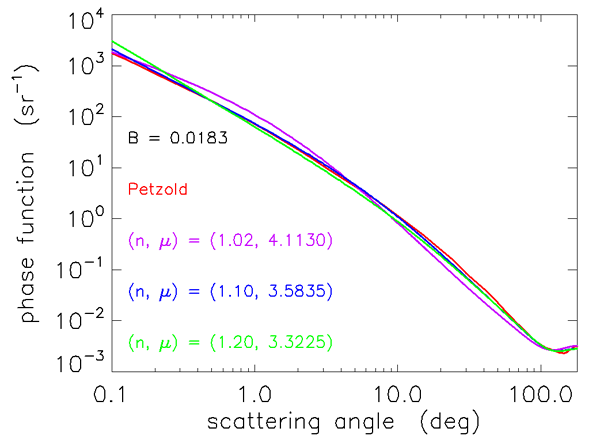
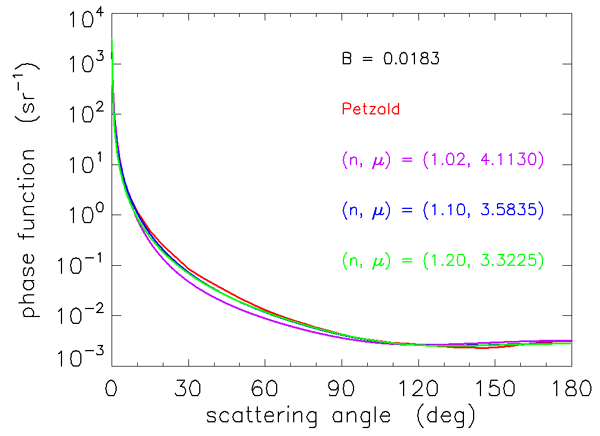
The relation between , , and is not unique. Figure 5 shows selected backscatter values given by Eq. (3) as a function of and . The red dot on the curve shows the values of and for which Eq. (1) gives the best fit to the Petzold average-particle phase function, as seen in Figs. 3 and 4. However, any pair of and values lying on a curve of constant in Fig. 5 will generate a slightly different phase function having the given value. The phase functions corresponding to the two red squares and the red dot on the contour give the phase functions shown in Figs. 6 and 7. These functions have somewhat different shapes, but any is still a reasonable approximation to the Petzold average particle phase function shown in red in those figures. Thus the exact and values used to generate a Fournier-Forand phase function with a given backscatter fraction are not critical for most applications.
 See comments posted for this page and leave your own.