Page updated:
March 16, 2021
Author: Curtis Mobley
View PDF
Chromaticity
Color Matching
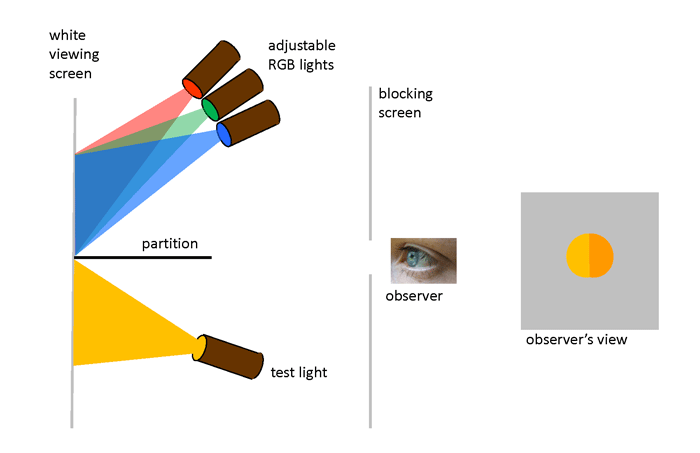
“Color-matching” experiments were performed in the 1850s by James Clerk Maxwell as he worked on his theory of trichromatic color vision. Further experiments in the late 1920s by W. D. Wright and J. Guild formed the foundation of modern color matching. The design of the Wright and Guild experiment is shown in Fig. 1. A box is divided into two sections by a partition. On one side of the partition, a test light shines light of any color onto a white viewing screen. On the other side of the partition, three adjustable lights can shine primary colors onto the viewing screen. These primary colors are usually taken to be red, green, and blue. The viewer can adjust the brighnesses of the individual R, G, and B lights, but not their wavelengths. The viewer then adjusts the brighnesses of the R, G, and B lights until their combined light matches the test color. The geometry restricts the observer’s vision to a 2 deg field of view. This means that the light from the viewing screen is collected at the fovea area of the observer’s retina, where the cone cells are most dense and where there is a minimum of rod cells.
The purpose of the Wright and Guild experiments was not to show that red, green, and blue lights can be combined to create another color. That was well known. Their intention was to get the data needed for developing a quantitative and unambiguous way to describe all colors visible to the human eye. That is to say, if I give you the “coordinates” of a color I see, you can reproduce that color. Wright and Guild of course had no idea in the 1920s that their work would find application decades later in color television, computer monotors, and digital cameras.
In their experiments it was found that a combination of monochromatic red, green, and blue lights (say, at wavelengths of 650, 550, and 450 nm) could match many, but not all, test colors. For example, if the test light is 500 nm, then no combination of 650, 550, and 450 nm light will give a perfect match to the visual color of light with a wavelength of 500 nm. To make a long story short, it was eventually determined that any color visible to humans with normal vision can be matched by mixing the light from three non-monochromatic “color-matching” spectra. These reference spectra are the CIE tristimulus functions, which are often called the CIE color-matching functions or spectra. Service (2016) has an excellent explanation of the path from the Wright-Guild experiments to the CIE tristimulus functions.
CIE Chromaticity Coordinates
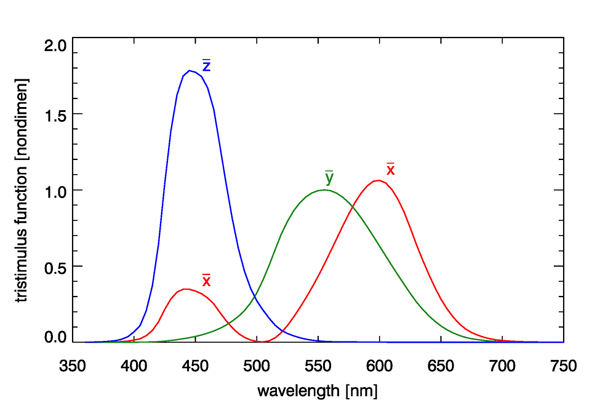
The Commission Internationale de l’Eclairage (CIE, or International Commission on Illumination) develops and publishes standards for all matters relating to photometry, including lighting, vision, and colorimetry. In 1931, based on the Wright and Guild data, the CIE published three color-matching, or tristimulus, functions. Although other similar functions have been developed over the years, e.g, for a 10 deg observer field of view, which includes more rod cells, the 1931 CIE two-degree tristimulus functions remain the most commonly used starting point for specification of color. These functions are shown in Fig. 2.
The tristimulus functions are used as follows. Given a spectrum , which could be radiance or irradiance, first compute the integrals
Here is the luminous efficacy, which was introduced on the Luminosity Functions and Units pages. The tristimulus functions have equal areas under the three curves, and each integrates to a value of (to three place accuracy). The and spectra do not represent actual light sources as might be used in a color-matching experiment, and they are certainly not red, green, and blue primary colors, because there is considerable overlap of the three spectra. The functions are just mathematical constructions that allow the unique specification of the visual color of a given spectrum via the values of and . The magnitudes of and depend on the magnitude of the spectrum, and the units of and depend on the whether is a radiance (in which case and are in lumens per square meter per steradian) or an irradiance (in which case and are in lumens per square meter).
To remove the dependence of the magnitude of from the computation of its color, next form
| (2) |
The quantities are called the chromaticity coordinates of the spectrum . Note that , so only two of these quantities are independent. By convention, and are used to specify the color.
The tristimulus function is identical to the photopic luminosity function discussed previously (and is almost identical to the response of the M cones). Thus the integral of Eq. (1b) is the same as the luminance integral seen previously. The values of are used to specify the color, independent of the magnitude of the spectrum, and is used to specify the brightness, which depends on both the shape of the spectrum and its magnitude.
Consider a spectrum that has unit magnitude at all wavelengths; this represents pure white light. (This is known as CIE reference illuminant E, with the “E” standing for Equal energy at each wavelength.) Inserting this spectrum into Eqs. 1 gives , so . This is known as the white point.
Now consider a spectrum that has unit magnitude at 500 nm and is zero at all other wavelengths: , where is the Dirac delta function. This spectrum picks off the values of the tristimulus functions at 500 nm, which are , and . From equations 1, the values of are then e.g., , with for integration (summation) at 5 nm resolution. These values give . If all pure wavelengths between 360 and 830 nm are processed in the same way, this generates a sequence of values known as the spectrum locus. The spectrum locus gives the color coordinates of monochromatic spectra, and the white point gives the color of a spectrum containing equal energy at all wavelengths.
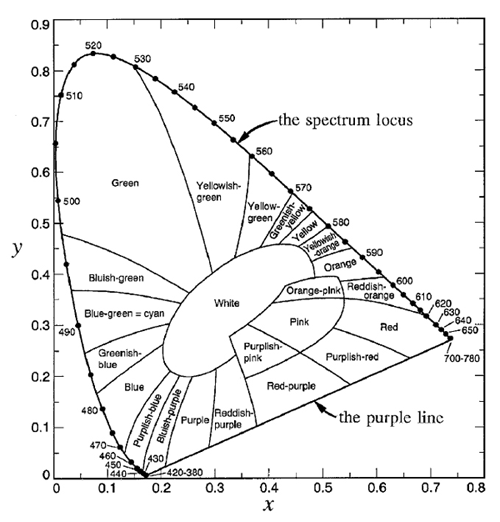
The spectrum locus defines a region of space in which any color visible to the human eye has a corresponding point. This plot is known as the CIE chromaticity diagram and is shown in Fig. 3. The region between 360 and 830 nm (often taken to be 400 and 700 nm since the eye is very insensitive outside 400-700 nm) is call the purple line. Purple is not a spectral color; it is the visual sensation generated by a mixture of red and blue light. Figure 4 shows the chromaticity diagram with the different regions labeled by their common color names.
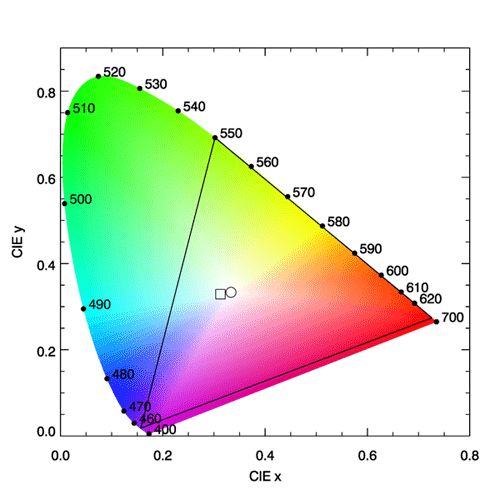
In Fig. 3, the interior of the black triangle shows the subset of colors that can be represented by a linear combination of red, green, and blue monochromatic lights with wavelengths of 650, 550, and 450 nm. This subset is called the gamut of colors that can be matched using those three wavelengths. We now see why it is not possible to match a pure color of 500 nm using any combination of intensities of lights at 650, 550, and 450 nm. The point on the spectrum locus labelled 500 is outside the gamut of those colors. However, the broadband tristumulus functions can match 500 nm, or any other color within the spectrum locus. It should be remembered that computer monitors generate colors by illuminating various combinations of more-or-less red, green, and blue pixels. No such RGB system can reproduce all visible colors; there will always be some colors outside the gamut triangle. Thus the colors seen on your computer monitor when viewing Fig. 3 are just an approximation of the real colors seen in nature for various spectra. On the other hand, the gamut of the eye is defined by various mixtures of all of the pure colors found on the spectrum locus.
Metameric Spectra
Every spectrum (that is not zero at all visible wavelengths) has a unique associated color , which is obtained from Eqs. (1) and (2). However, the converse is not true: every color corresponds to many different spectra. Different spectra and that have the same color are called metameric spectra or metamers. (Strictly speaking, two different spectra are metameric if they have the same color coordinates for a given reference illuminant and reference observer.)
CIE reference illuminant D65 is a commonly used spectrum that simulates outdoor light at mid-day on a sunny, clear day. This spectrum has color coordinates , which lies somewhat on the blue side of the white point. This shift towards the blue simulates the contribution by blue sky radiance to the whiter light of the Sun’s direct beam. The “D” stands for daylight, and the “65” indicates that it has a “correlated color temperature” of 6,500 K. (The CIE has published many other reference spectra, e.g. for tungsten-filament lights, fluorescent lights, LED lights, etc.). The color of the D65 spectrum is shown by the square symbol in Fig. 3.
Figure 5 shows the D65 spectrum and three spectra that are metameric to it. To create the first of these spectra, I started with a pure white spectrum and added more energy at 490 nm until the chromaticity coordinates of the resulting spectrum, shown by the cyan curve in Fig. 5, was the same as that of the D65 spectrum. Another metameric spectrum was created by starting with white and removing one half of the energy at wavelengths of 590 to 610 nm. Removing red from white leaves a spectrum with a bluish color. Since the D65 color point lies within the gamut of the 650, 550, and 450 nm pure colors, I then adjusted the amounts of monochromatic 650, 550, and 450 energy until the resulting three-wavelength spectrum had the same as the original D65 spectrum (0.4503 parts of 450 nm, 0.6311 parts of 550 nm, and 1.000 parts of 650 nm).
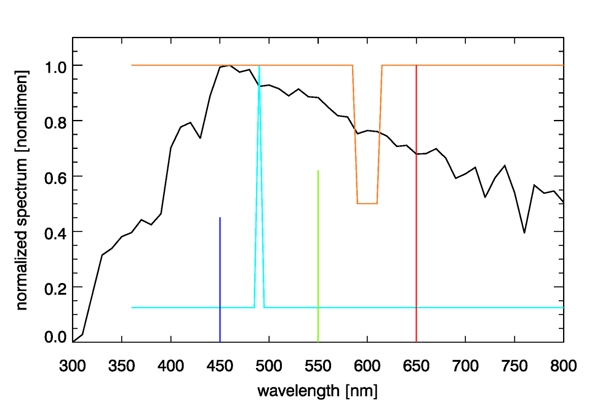
The four spectra seen in Fig. 5 are entirely different spectra from the viewpoint of radiometry, but they are identical from the viewpoint of photometry. That is, a radiometer would measure the much different spectra seen in the figure, but the eye sees each of these as having exactly the same color. It may seem peculiar that the eye-brain system cannot distinguish these four spectra, but the reason goes back to the three types of pigments in cone cells as discussed on the Color Vision page. You cannot do better spectrum discrimination with just three overlapping color sensors. Our simian ancestors no doubt found it advantageous to be able to distinguish ripe blueberries and ripe red strawberries from unripe green ones, so that is the ability that evolution has given us. There is no need for us to see a full spectrum. One might imagine our eyes eventually evolving into radiometers, in which case we might see tables of numbers or plots of spectra, instead of colors, when we look at things. That might give us the ability to mentally extract the chlorophyll concentration when looking at the ocean, but there was no evolutionary value of that ability on the plains of Africa 5 million years ago.
 See comments posted for this page and leave your own.