Page updated:
March 13, 2021
Author: Curtis Mobley
View PDF
CDOM Fluorescence
This page tailors the general fluorescence theory seen on the Theory of Fluorescence and Phosphorescence page to the case of fluorescence by colored dissolved organic matter (CDOM). The goal is to develop the quantities needed for prediction of CDOM fluorescence contributions to oceanic light fields using a radiative transfer model like HydroLight. For convenience of reference, it is recalled from the theory page that the quantities needed are
- the CDOM fluorescence scattering coefficient , with units of ,
- the CDOM fluorescence wavelength redistribution function , with units of , and
- the CDOM fluorescence scattering phase function , with units of .
These quantities are then combined to create the volume inelastic scattering function for CDOM fluorescence
| (1) |
The subscript Y indicates yellow matter, i.e. CDOM.
The CDOM Fluorescence Scattering Coefficient
For CDOM fluorescence, the inelastic “scattering” coefficient in the formalism of treating fluorescence as inelastic scattering is just the absorption coefficient for CDOM. In other words, what matters is how much energy is absorbed by CDOM at the excitation wavelength , which is then available for possible re-emission at a longer wavelength . Note that it is only energy absorbed by CDOM molecules that matters for CDOM fluorescence. Energy absorbed by chlorophyll in phytoplankton or pollutants such as oil may (or may not) fluoresce, but that is not CDOM fluorescence. Thus the needed CDOM fluorescence scattering coefficient is commonly modeled as
| (2) |
where is the absorption by CDOM at a reference wavelength , which is usually taken to be 400 or 440 nm, and is a spectral slope parameter. is usually in the range of 0.016 to , but can vary from 0.007 to 0.026. See Fig. 1 of the IOP models page for further discussion. (As noted on the CDOM page, the elastic scattering coefficient for CDOM is usually assumed to be zero.)
The CDOM Fluorescence Wavelength Redistribution Function
Figure 1 shows a measured spectral fluorescence quantum efficiency function for CDOM, , as measured by Hawes (1992) on a sample of water from the Gulf of Mexico on the West Florida Shelf (his station FA7). Other measurements in the Gulf of Mexico, Peru upwelling, and North Atlantic showed similar shapes, although with different magnitudes and some variability in the details.
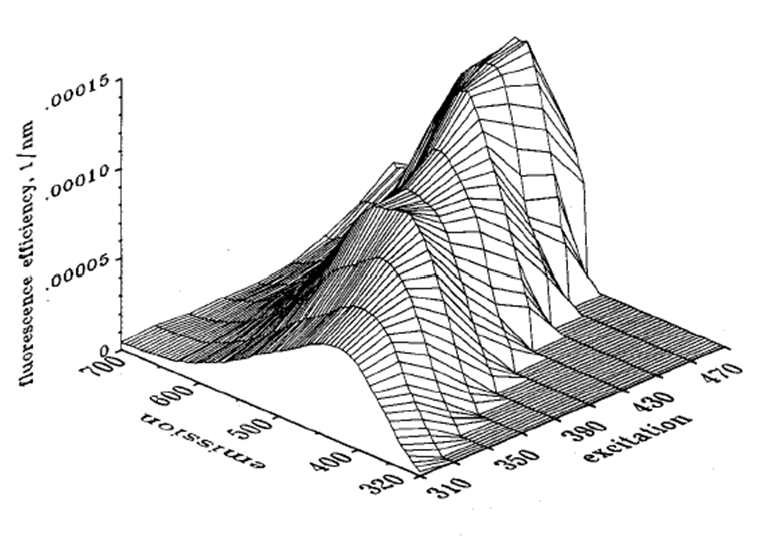
Hawes was able to fit his measurements to a function of the form (his Eq. 10)
| (3) |
Here has units of , and are dimensionless, and and have units of . The values of these model parameters are determined by a best fit of the model to the measured data. For the data of Fig. 1, the best-fit values are shown in Table 1.
| 310 | |
| 330 | 6.34 |
| 350 | 8.00 |
| 370 | 9.89 |
| 390 | 9.39 |
| 410 | 10.48 |
| 430 | 12.59 |
| 450 | 13.48 |
| 470 | 13.61 |
| 490 | |
| 0.470 | |
The left panel of Fig. 2 shows the best-fit values of Table 1 as solid dots. The open dots are values extended to other wavelengths for use in the HydroLight radiative transfer software. The corresponding quantum efficiencies are obtained by integration of over :
| (4) |
The right panel of Fig. 2 shows the dependence of on the excitation wavelength for the parameter values of Table 1 as extended and used in Eq. (3). Unlike the quantum efficiency for chlorophyll fluorescence, the quantum efficiency for CDOM fluorescence depends on the excitation wavelength.
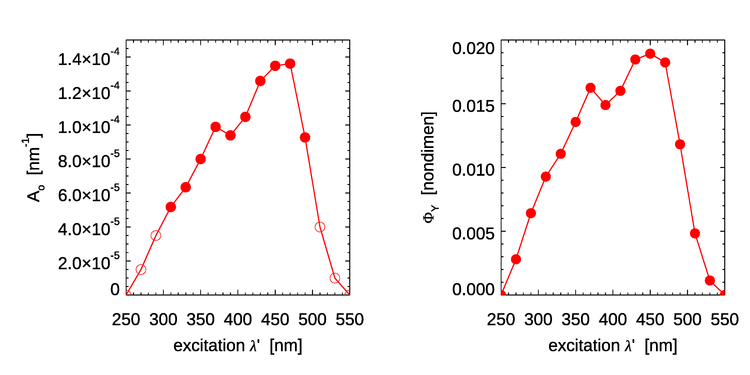
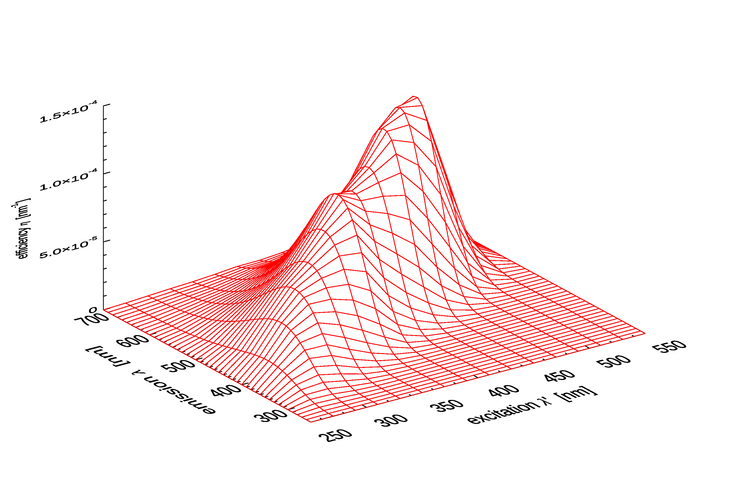
Figure 3 shows as computed by Eq. (3) for the parameter values of 1 as extended.
As seen in Fig. 1 of the CDOM page and as modeled by Eq. (2), absorption by CDOM continues to rise rapidly in the ultraviolet (UV). As seen in Fig. 1, CDOM fluorescence is excited by UV wavelengths even below 300 nm, and CDOM emission occurs at wavelengths from the excitation wavelength into the blue and green. Thus CDOM is optically important both because of its strong absorption at blue and UV wavelenghts, and because it can fluoresce at UV to blue and green wavelengths.
As noted on the theory page, the CDOM fluorescence wavelength redistribution function is obtained from via
| (5) |
The excellent Master’s Thesis by Hawes remains, three decades later, the one and only publication I can find that presents measurements and a model for calibrated spectral fluorescence quantum efficiency functions for CDOM (or for any other substance). His functional form (3) is used in HydroLight to model CDOM fluorescence. The parameter values seen above are the defaults in HydroLight. Although the results of his thesis research were presented at the Ocean Optics XI conference (Hawes et al. (1992)), they were never published in the refereed literature. The thesis itself cannot be found online, but a photocopy can be downloaded on the references page.
The CDOM fluorescence phase function
As previously noted, fluorescence emission is isotropic. Therefore the phase function is simply
The models seen above give everything needed to construct the volume inelastic scattering function of Eq. (1) for CDOM fluoresecence, , which is then ready for use in the radiative transfer equation as seen in Eq. (2) of the theory page.
Examples of CDOM Fluorescence Effects
The HydroLight radiative transfer model has options to include or omit the inelastic scattering processes of Raman scatter by water and fluorescence by chlorophyll and CDOM.
To see the effect of the CDOM fluorescence on the remote sensing reflectance , a series of HydroLight runs was done with the following inputs:
- A chlorophyll concentration of for Case 1 water (using the new Case 1 IOP model in HydroLight); the water was homogeneous and infinitely deep
- Low and high values of CDOM absorption was included as either
- CDOM absorption at 440 nm was 20% of the chlorophyll absorption at 440 nm, i.e. . This is a common model for Case 1 water.
- CDOM absorption at 440 nm was 5 times the chlorophyll absorption at 440 nm, i.e. . This represents a very a high concentration of extra CDOM as could result from river input into coastal water or by the decay of benthos such as sea grass, which gives Case II water.
- CDOM fluorescence was modeled using the parameter values shown above for the Hawes Station FA7
- Sun at a zenith angle of 30 deg in a clear sky, wind speed of
- The run was from 300 to 750 nm by 5 nm
- Four sets of inelastic effects were simulated: (1) no inelastic effects at all, (2) Raman scatter only, (3) CDOM fluorescence only, and (4) Raman scatter plus CDOM and chlorophyll fluorescence.
Figure 4 shows the results of these simulations. The top panel is for the Case 1 water with . The bottom panel is for the high-CDOM Case 2 water with . For the low-CDOM, Case 1 water, the simulation with CDOM fluorescence increases by less than 2% over the elastic-only case. Raman scatter gives up to an 8% increase over elastic only. For the high-CDOM Case 2 water, Raman gives up to a 7% increase, but CDOM fluorescence gives up to a 27% increase in . Thus, it is possible for CDOM fluorescence to have a significant effect on , but it takes a very high CDOM concentration to do so. In low-to-medium CDOM waters, typical of the open ocean where CDOM covaries with chlorophyll, CDOM fluorescence affects by at most a few percent. If these spectra are used in band-ratio algorithms for retrieval of environmental variables such as the chlorophyll concentration, the CDOM-fluorescence enhancement to should have even less affect on the retrieved values. This conclusion is consistent with the findings in Hawes et al. 1992). Note also that CDOM fluorescence has a minimal effect in the chlorophyll-fluorescence band near 685 nm.
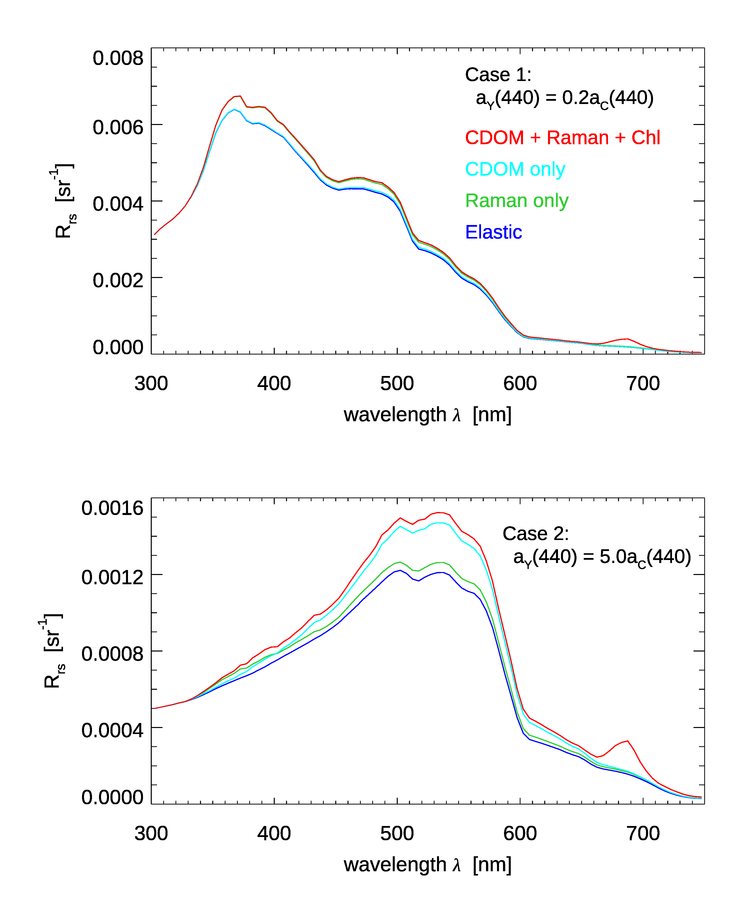
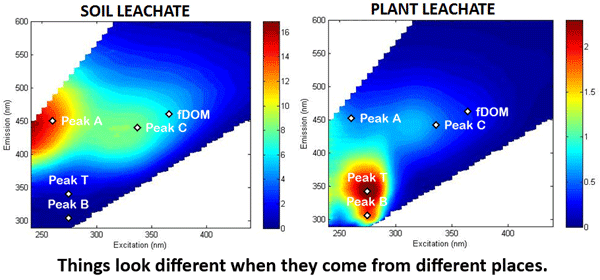
Figure 5 shows excitation-emission functions as commonly seen in the literature. Such measurements are used to identify the presence (or absence) of various types of fluorescing compounds in the water. The original figure does not comment on the measurement units, which are often counts per second or something similar. In any case, these excitation-emission plots display relative values and are not the equivalent of the calibrated spectral fluorescence quantum efficiency functions discussed above and seen in Figs. 1 and 3.
 See comments posted for this page and leave your own.