Page updated:
November 26, 2020
Author: Emmanuel Boss
View PDF
Water
Water contributes to both absorption and scattering in natural waters. In clear ocean waters, the effect of water on ocean color in the visible cannot be neglected and must be taken into account. In the near infrared, water almost always dominates absorption. Temperature and salinity affect both absorption and scattering by water and hence need to be taken into account when the optical properties of water are computed.
The Index of Refraction of Water
In the study of light propagation through water using Maxwell’s equations, the index of refraction is usually written as a complex number,
where is the real part and is the imaginary part. Both and are positive numbers, and both depend on wavelength or frequency. Their magnitudes and wavelength dependence depend on the material.
The real index of refraction governs the elastic scattering of light, as seen on the Physics of Scattering page. The imaginary index of refraction determines the absorption of propagating light and in oceanography is usually expressed via the absorption coefficient of the material. These are related by (e.g., Bohren and Huffman (1983) Eq. (2.52))
The real part of the index of refraction
Figure 1 shows the real index of refraction of pure water over the wavelength range of 10 nm to 10 m. For wavelengths less than 10 nm the value remains at 1, and for wavelengths longer than 10 m the value remains at about 8.85.
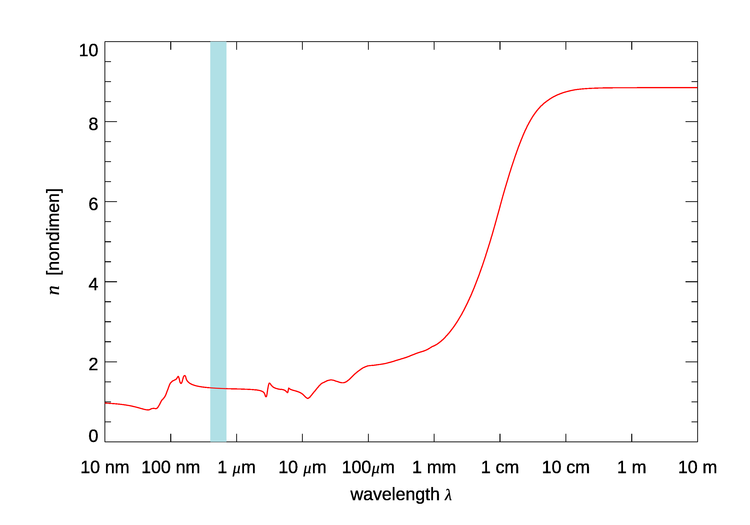
Figure 1 is for pure water at room temperature. There are small temperature and salinity effects in the visible region, which are not seen in Fig. 1. In the 200 to 1100 nm region of interest in optical oceanography, the real part of the index of refraction of water relative to air, , as given by Quan and Fry (1995) is
| (1) |
where is temperature in Celsius, is salinity in PSU, and is the wavelength in nanometers. [PSU is equivalent to parts per thousand mass of dissolved salts to mass of pure water, or g/kg.] Table 1 gives the values of the coefficients , which were determined by fitting Eq. (1) to the measurements of Austin and Halikas (1976).
For pure (fresh) water (), Eq. (1) reduces to
| (2) |
Although developed from data in the 400-700 nm range, Zhang and Hu (2009) find that Eq. 2 fits data from 200-1100nm with an average error of . Huibers (1997) reached a similar conclusion about the excellent performance of Eq. 2.
There is also some pressure effect on ; however, this effect is small because water in very incompressible. Table 2 shows values of for the extreme ranges of pressure, temperature, salinity, and wavelength relevant to optical oceanography. For near-surface waters, falls in the range of 1.33 to 1.35. Even including the extreme depth values, varies by less than 3% over the entire parameter range. For comparison, living phytoplankton typically have “low” indices of refraction, in the range 1.01 to 1.09 relative to the index of refraction of pure seawater. Detritus and inorganic particles generally have “high” indices, in the range of 1.15 to 1.20 relative to seawater.
| 0 | 0 | 400 | 1.344186 | |
| 1.01 | 0 | 0 | 700 | 1.331084 |
| 1.01 | 0 | 35 | 400 | 1.351415 |
| 1.01 | 0 | 35 | 700 | 1.337906 |
| 1.01 | 30 | 0 | 400 | 1.342081 |
| 1.01 | 30 | 0 | 700 | 1.329128 |
| 1.01 | 30 | 35 | 400 | 1.348752 |
| 1.01 | 30 | 35 | 700 | 1.335316 |
| 0 | 0 | 400 | 1.360076 | |
| 1.08 | 0 | 0 | 700 | 1.346604 |
| 1.08 | 0 | 35 | 400 | 1.366885 |
| 1.08 | 0 | 35 | 700 | 1.352956 |
| 1.08 | 30 | 0 | 400 | 1.356281 |
| 1.08 | 30 | 0 | 700 | 1.342958 |
| 1.08 | 30 | 35 | 400 | 1.362842 |
| 1.08 | 30 | 35 | 700 | 1.348986 |
Harvey et al. (2009) give additional tables of at selected wavelengths, including temperatures up to 500 C and pressures up to .
The imaginary part of the index of refraction
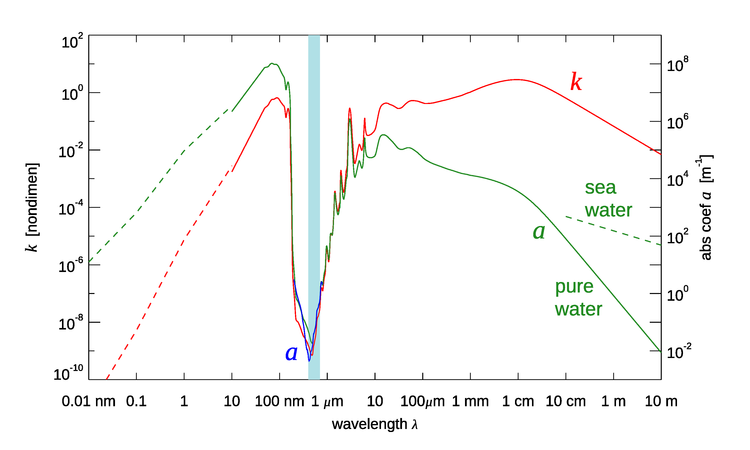
The imaginary part of the index of refraction for pure water is shown as a function of wavelength in vacuo by the red line in Fig. 2. The corresponding absorption coefficient is shown in green. Starting at the small-wavelength (X ray) end of the spectrum, the absorption rises as Compton scattering and then the photoelectric effect (see The Nature of Light) come into play, removing energy from the incident light. The peak near 100 nm is due to the collective excitation of all of the electrons in the water molecule. Going into the near-ultraviolet, there is an extremely rapid decrease in with wavelength when the photon energy is no longer able to excite electron transitions of the water molecule. The minimum value is at blue wavelengths in the visible part of the spectrum, which is shown by the light blue band in the figure. Absorption then rises again going into the infrared. In gaseous water, near-infrared wavelengths excite rotational modes of water molecules. However, these modes are quenched in liquid water because the molecules cannot freely rotate. In liquid water, the individual peaks between the visible and about are caused by O-H stretching modes of the water molecule being excited. Going further into the microwave region, absorption by pure water remains much higher than in the visible but decreases as the longer and longer wavelengths have less and less energy for exciting vibrational states. Finally, when the wavelength is around 10 m, far into the radio region of the spectrum, the absorption is again comparable to that at blue wavelengths.
The green dashed line in the figure for shows the absorption for sea water, which is a conductor because of the salt ions. The absorption for radio waves is then much higher than for pure water. The extrapolation of the salt-water curve to longer wavelengths is supported by theoretical considerations, which show that the absorption should be proportional to (see Jackson (1975), §7.5). If this is done, the absorption by sea water again becomes comparable to that at visible wavelengths for wavelengths of order 1000 km. This part of the spectrum is called “extremely low frequency,” or ELF, and has frequencies of 100 Hz or less. The “clarity” of seawater at ELF frequencies has not escaped the attention of the world’s navies. Several countries have built transmitters that operate at ELF frequencies to communicate with submerged submarines; see, for example, Communication with Submarines and Project Sanguine. The downside of communication at ELF frequencies is that the antennas must be very large, of order 100 km in size, and the data transmission rates are as low as only a few bytes per second.
The next section takes a closer look at the temperature and salinity effects on absorption at the wavelengths of interest in optical oceanography.
Absorption by Water
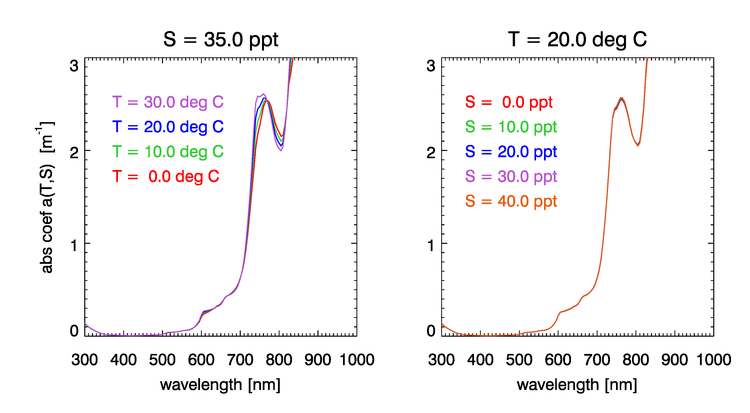
Absorption by water has a rich structure due to the the excitation of the different vibrational modes of the water molecule. Water absorption can be computed using empirical functions of the water temperature and salinity . Figure 3 shows the dependence of the water absorption coefficient on for , and on for . These curves were computed using the semiempirical equations of Roettgers et al. (2014). The temperature effect on absorption is largest in the regions around 740 and 800 nm (and in several bands beyond 800 nm, not seen in this figure). The figure shows that salinity has much less effect on absorption than does temperature.
A compendium of published research on water absorption and values gives access to historical publications on water absorption going back to 1929.
Elastic Scattering by Water
According to Einstein-Smoluchowski theory (see the Physics of Scattering page), the elastic scattering of light by water is due to fluctuations in the dielectric constant in space caused by random motion of molecules (see Zhang and Hu (2009) and Zhang et al. (2009) for a recent review). Elastic scattering by water has similarities in angular shape and spectral behavior to Rayleigh scattering (scattering by spherical particles that are much smaller than the wavelength of the light), however with important differences. For example, the VSF is
| (3) |
where is the scattering angle and is the depolarization ratio. Several depolarization ratios have been suggested, with providing the best fit to data (Zhang et al. (2009)).
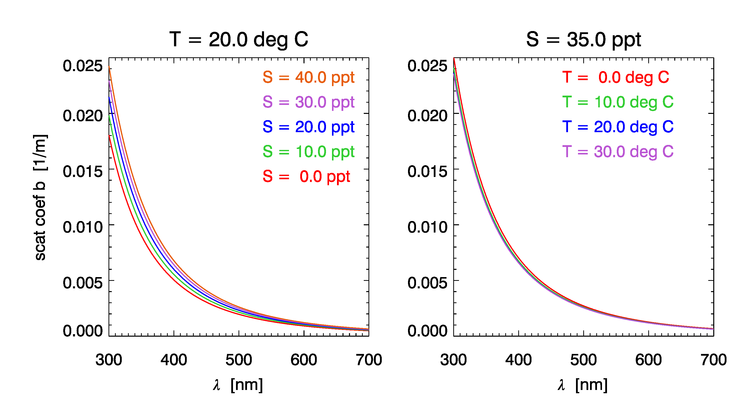
The elastic scattering coefficient of sea water depends on salinity ( increase for range of salinities normally observed in the oceans), much less so of temperature ( between 0 and ), and still less for pressure ( for an increase in P of 100bar). Figure 4 shows the dependence of the water scattering coefficient on and according to the model of Zhang et al. (2009).
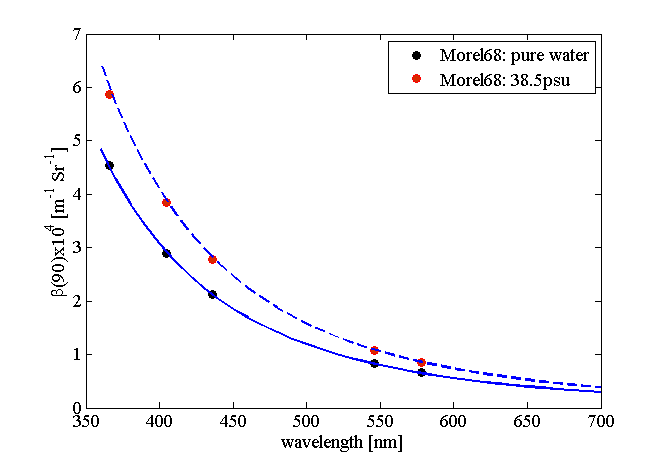
Rather than repeat the derivations from Zhang and Hu (2009) and Zhang et al. (2009), we provide a link to a MATLAB function that provides their results and computes the scattering coefficient and the VSF of water at 90 degrees for a given wavelength, salinity and temperature. Figure 5 shows example plots computed using the MATLAB code of Zhang .
Raman Scattering by Water
Water molecules also scatter light inelastically. This is call Raman scattering. The Raman Scattering page goes into the details of Raman scattering and illustrates its effects on oceanic light fields.
 See comments posted for this page and leave your own.